Install and Set Up an AWS CloudWatch Agent For Memory Metric using AWS System Manager


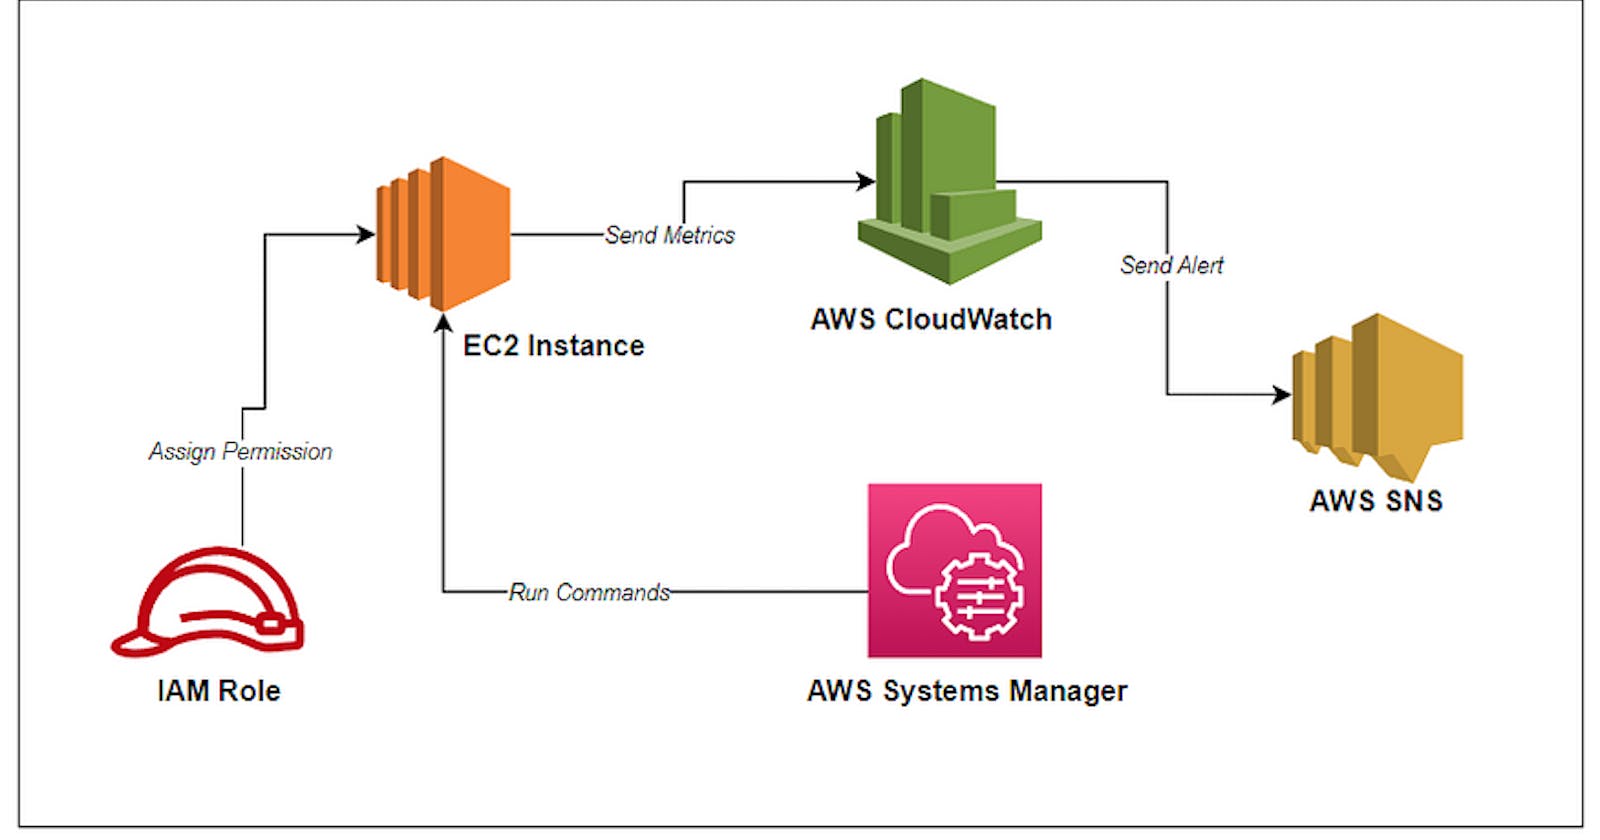
Table of contents
- Introduction
- Prerequisites
- Steps to Setup CloudWatch Agent and Create an Alarm.
- Step 1: Create IAM Role and attach it to the EC2 Instance.
- Step 2: Install SSM Agent On EC2 Instance.
- Step 3: Install CloudWatch agent using SSM.
- Step 4: Add CloudWatch agent configuration to the AWS Parameter Store
- Step 5: Install CloudWatch agent configuration using SSM.
- Step 6: Check the Memory Metrics On AWS CloudWatch.
- Step 7: Create an SNS Topic.
- Step 8: Create a CloudWatch Alarm.
- Conclusion:
- Follow-up
Introduction
By default, AWS CloudWatch does not collect the memory metrics from the EC2 Instances. In order, to get the memory usage we need to need to install the CloudWatch Agent on EC2 Instance. In this blog, we will install the AWS CloudWatch agent using AWS System Manager & collect memory metrics in the AWS CloudWatch console, after that we will create an alarm in AWS CloudWatch which will send an alert email notification when the memory usage goes above 75% using AWS SNS topic.
Prerequisites
An EC2 Instance should be launched and running.
The user should have the IAM permissions to perform IAM, EC2, Systems Manager, SNS, and CloudWatch activities.
Steps to Setup CloudWatch Agent and Create an Alarm.
Create and Assign an IAM Role to the Ec2 Instance.
Install and Enable SSM Agent on the EC2 Instance.
Install CloudWatch Agent using AWS SSM Run Command.
Add the CloudWatch Agent JSON configuration file to the Parameter Store.
Configure CloudWatch Agent configuration using SSM.
Check the memory metrics in the AWS CloudWatch console.
Create an SNS Topic and subscribe to the email notification.
Create a CloudWatch Alarm.
Step 1: Create IAM Role and attach it to the EC2 Instance.
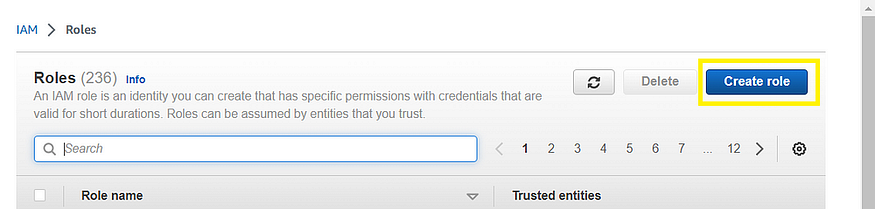
First, go to the IAM service and select Roles from the menu on the screen’s left-hand side located under the Access Management category.
- From the Roles screen, select Create Role, located at the top of your screen.
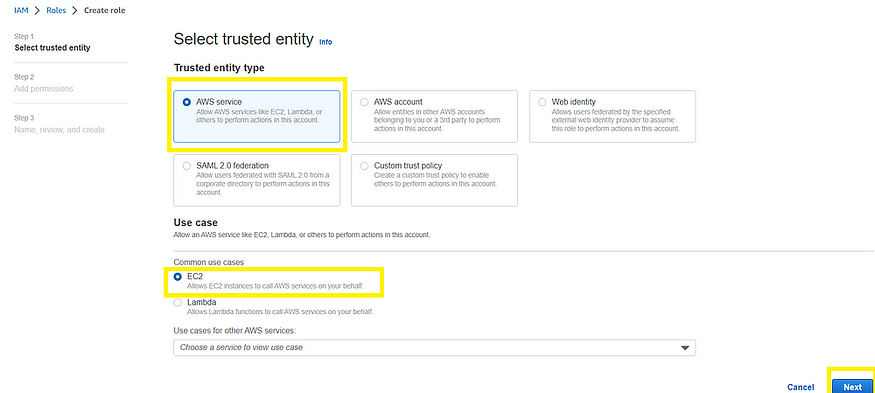
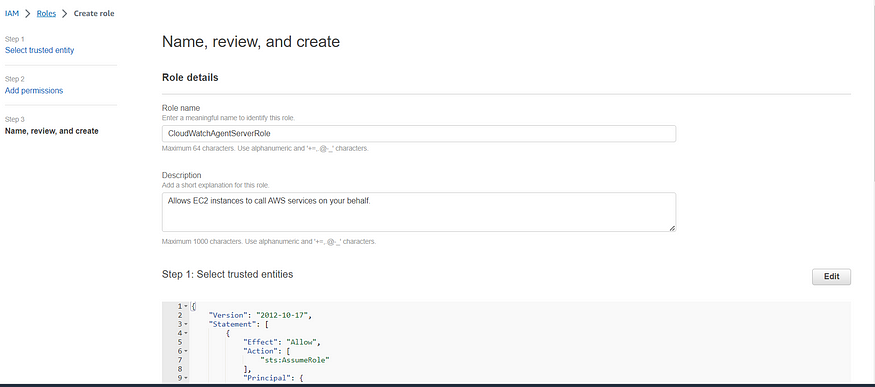
2. On the Create Role page, designate the Type of Trusted Entity as AWS Service. AWS Service roles allow AWS services to interact with other resources (e.g. CloudWatch) on your behalf.
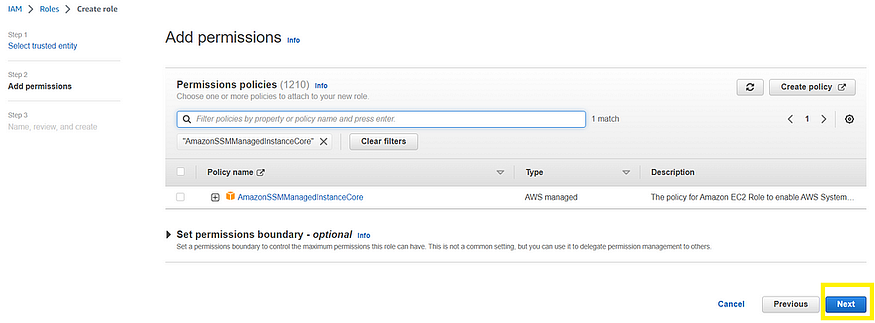
3. On the permissions page, select “CloudWatchAgentServerPolicy” and “AmazonSSMManagedInstanceCore” AWS-managed policies. After checking the box, select Next.
4. Assign your role a unique name and select Next and then Create Role. In the following screenshot, I name it as CloudWatchAgentServerRole.
After successfully creating the Role and it’s time to Assign it to the EC2 Instance.
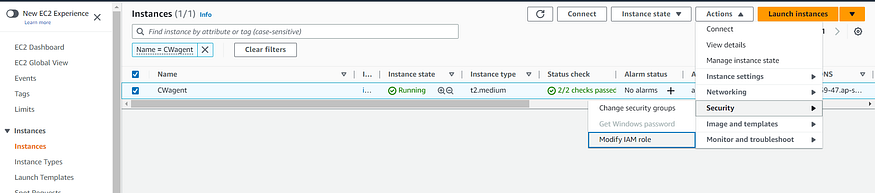
5. Go to the EC2 Instance select the instance on the left side Select the Actions → Security → Modify IAM Role. The Modify IAM Role option brings you to a menu that allows you to select and attach the IAM role created earlier.
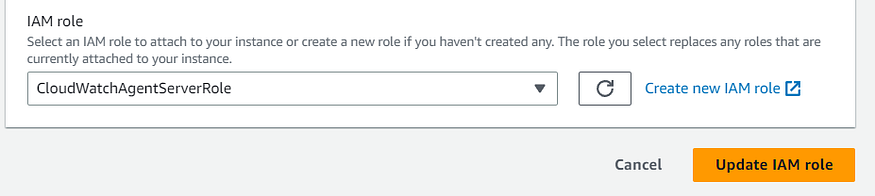
6. Now, select the role you created earlier “CloudWatchAgentServerRole” from the drop-down menu and then click Save.
Step 2: Install SSM Agent On EC2 Instance.
SSH into your EC2 Instance and follow the below steps to install the SSM agent.
- Download the SSM agent and run the agent installer using the below command.
sudo yum install -y https://s3.amazonaws.com/ec2-downloads-windows/SSMAgent/latest/linux_amd64/amazon-ssm-agent.rpm
2. To start the amazo-ssm-agent service, run the below command.
sudo systemctl start amazon-ssm-agent
3. To enable the amazon-ssm-agent service to start on system reboot or boot up.
sudo systemctl enable amazon-ssm-agent
4. To check the status of the ssm agent.
sudo systemctl status amazon-ssm-agent
Step 3: Install CloudWatch agent using SSM.
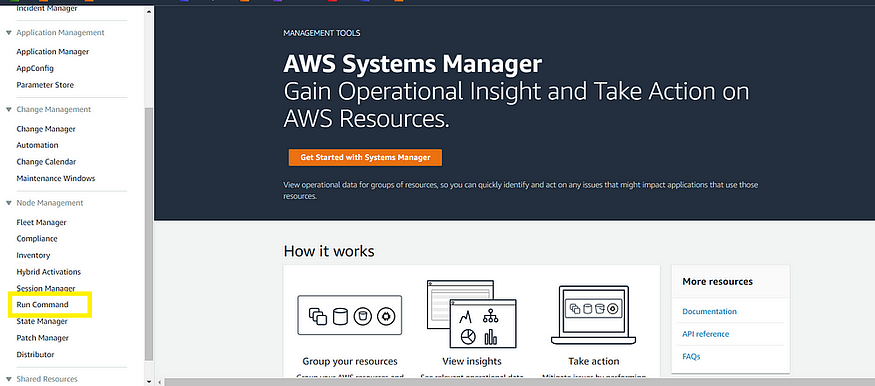
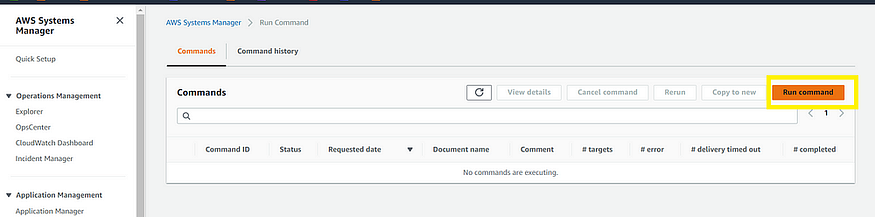
- To install the CloudWatch agent to the EC2 Instance go to the AWS Systems Manager service on the left side scroll down under Node Management select “Run Command”.
2. Once you selected the Run Command you will be promoted to the Run Command Dashboard then, on the right side click on Run Command Button.
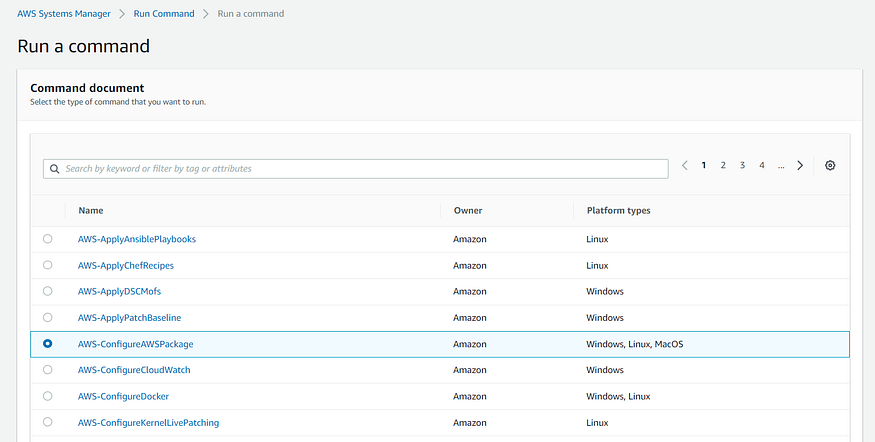
3. On the Command section select the “AWS-ConfigureAWSPackage” to install the Cloudwatch agent to the EC2 Instance.
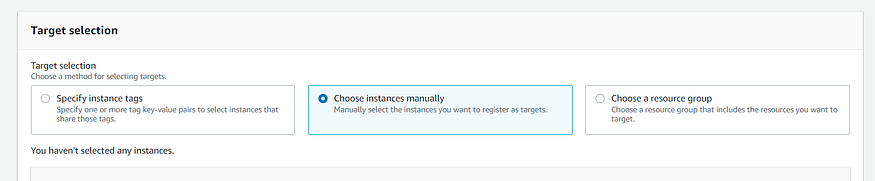
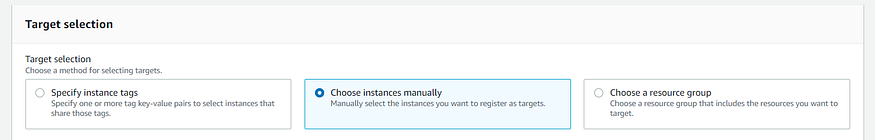
4. Now, Select the Target scroll down to the Target selection and “Choose instances manually” option, and leave everything default.
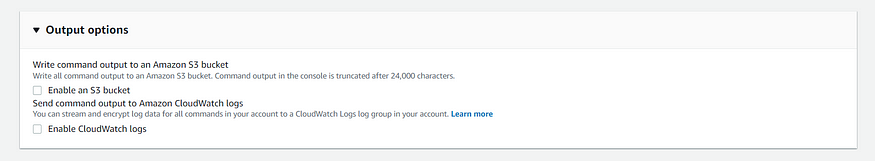
5. We don’t need the command output to store in an S3 bucket So, In the Output options deselect the options shown in the image below.
6. After that click on Run, You will see the state is pending wait for 10–15 seconds it will show the state as successful which means your CloudWatch agent has been successfully installed on the EC2 Instance.
Step 4: Add CloudWatch agent configuration to the AWS Parameter Store
Add the CloudWatch agent configuration on the Parameter Store to collect memory metrics.
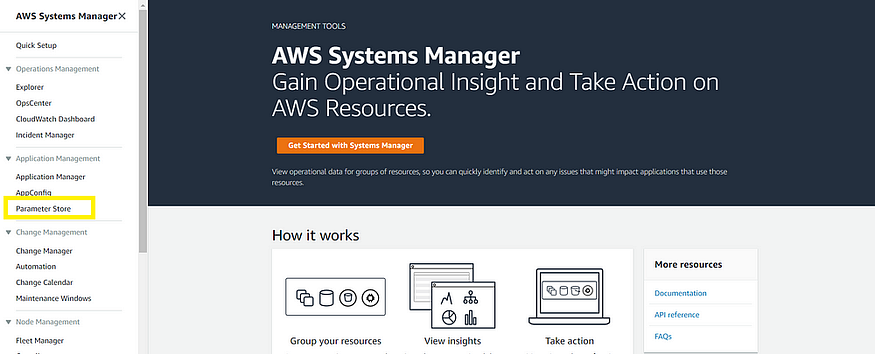
- Go back to the System Manager service, on the left side under Application Management click on Parameter store.
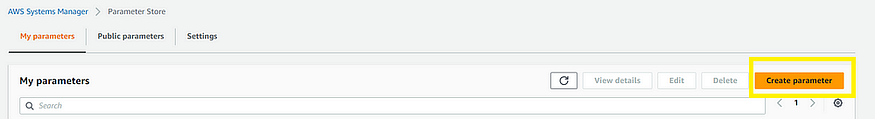
2. Click on the Create parameter.
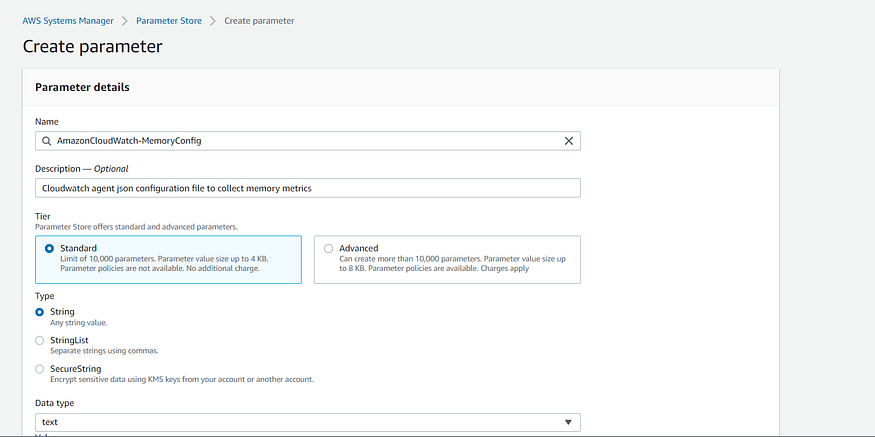
3. Give a unique name “AmazonCloudWatch-MemoryConfig” and add a description select Standard Tier, Type “String”, and Data type “Text”.
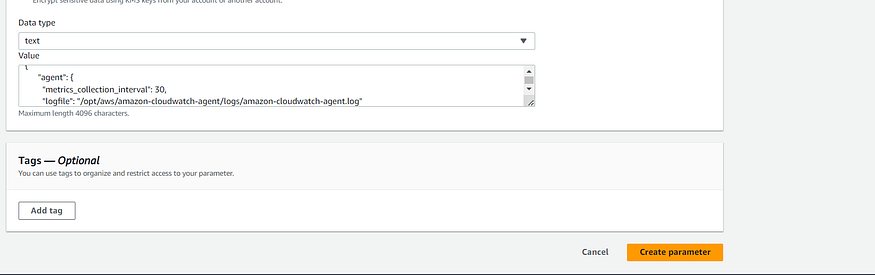
4. Under Value copy & paste the below JSON values which will collect memory metrics after every 30 seconds.
{
      "agent": {
        "metrics_collection_interval": 30,
        "logfile": "/opt/aws/amazon-cloudwatch-agent/logs/amazon-cloudwatch-agent.log"
      },
"metrics": {
    "metrics_collected": {
      "mem": {
        "measurement": [
          {"name": "used", "rename": "MemoryUsed"},
          {"name": "mem_available", "rename": "MemoryAvailable"}
        ]
        }
      },
    "append_dimensions": {
      "InstanceId": "${aws:InstanceId}"
    }
  }
}
5. Now, click on Create parameter.
Step 5: Install CloudWatch agent configuration using SSM.
To install the CloudWatch agent configuration on the EC2 Instance. Go back to the System manager Run Command.
- Search for “AmazonCloudWatch-ManageAgent” and select it to install the CloudWatch manage agent which will install the configuration.

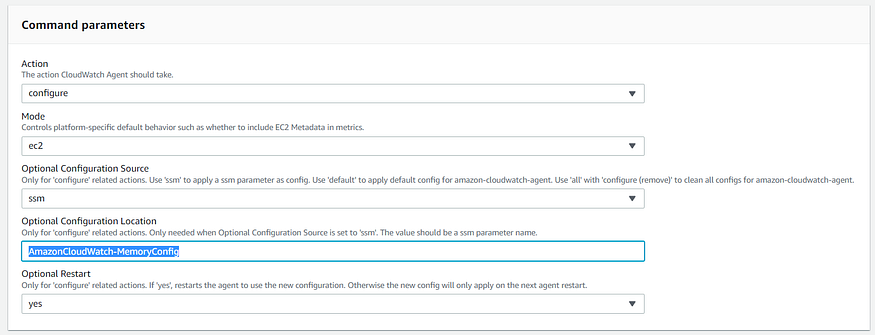
2. In the Command parameters add the “Optional Configuration Location” to the parameter name that we have created in the previous step. Make sure the Configuration Location name should be same as the parameter name i.e “AmazonCloudWatch-MemoryConfig”.
3. Under Target Selection “Choose instances manually” option and select your instances.
4. Now, we don’t want the command output to be stored in an S3 bucket So, In the Output options deselect the options.
5. After that click on Run, You will see the state is showing in pending wait for 10–15 seconds it will then show the state as successful which means your CloudWatch agent memory metrics configuration has been successfully installed on the EC2 Instance.
Step 6: Check the Memory Metrics On AWS CloudWatch.
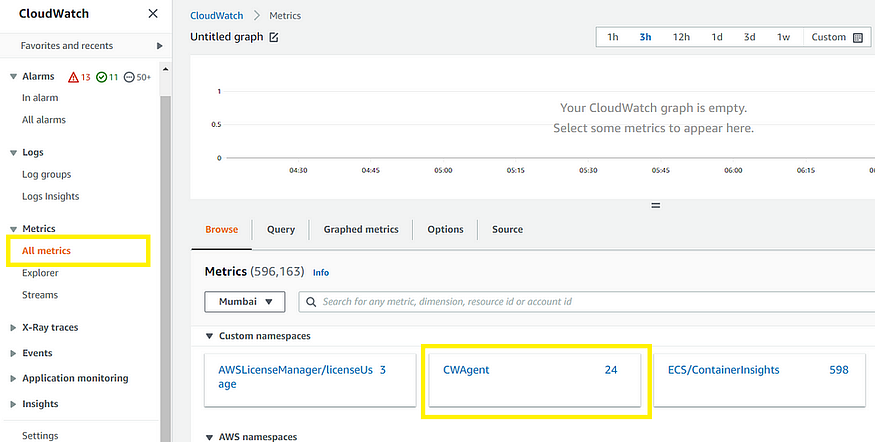
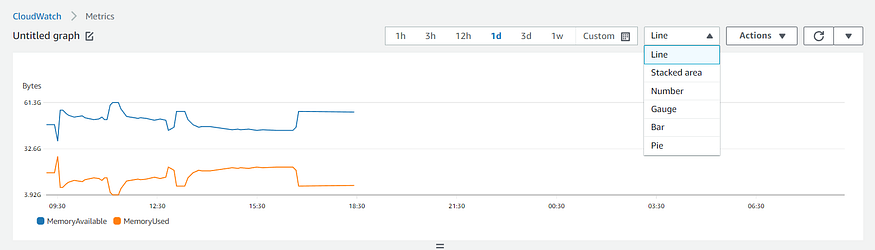
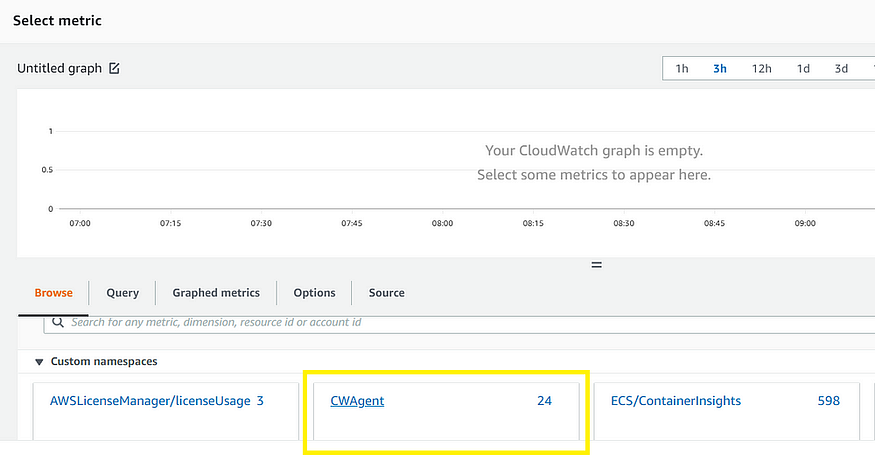
After successfully installing the CloudWatch agent and CloudWatch memory metrics configuration Go to the AWS CloudWatch service on the left side under Metrics and select “All metrics” you will see “CWAgent” under custom namespaces click on that.
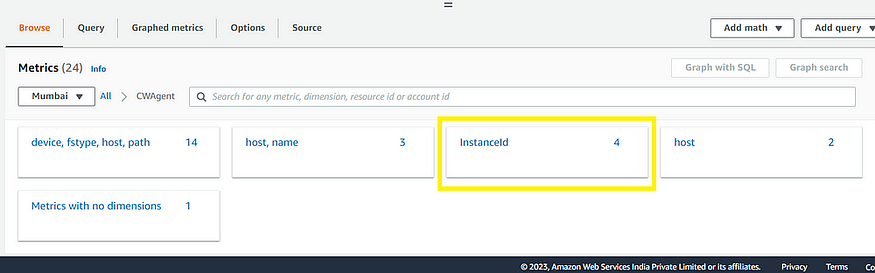
Now, Click on the InstanceId and select your instances to view metrics.
You will see the two metrics names generated for your Ec2 Instance “MemoryAvailable” and “MemoryUsed” select both of them and see the graph above. Based on both metrics you will see a graph like this shown in the below image. You can also select customize the graph to show the data by selecting various graph forms on the right side.
Step 7: Create an SNS Topic.
In this step, we will create an SNS topic and subscribe to that topic with our email address from where we are going to send the alerts.
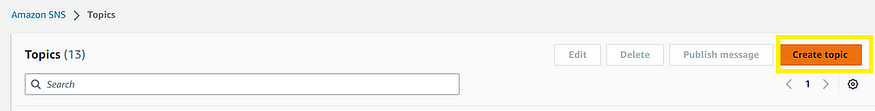
- Go to the SNS service and select topics on the left side and click on Create Topic.
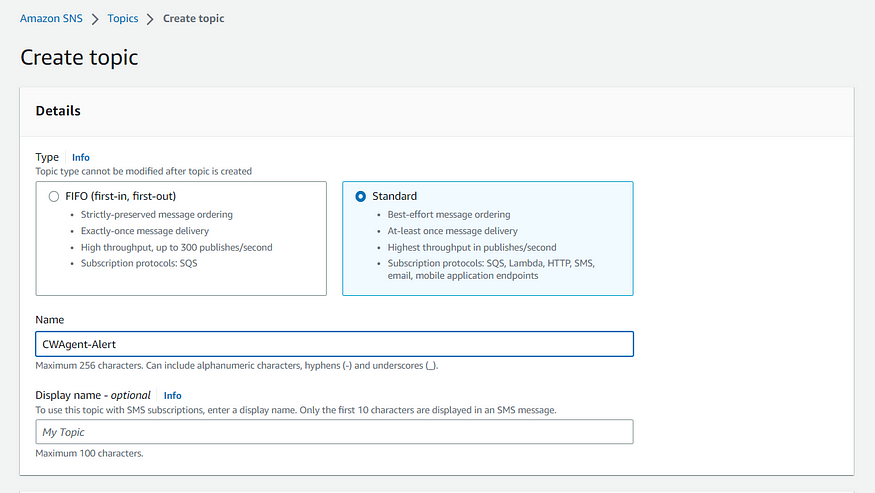
2. Select “Standard” Type and give a name to the SNS topic like “CWAgent- Alert” leave the rest of the options default and click on Create Topic.
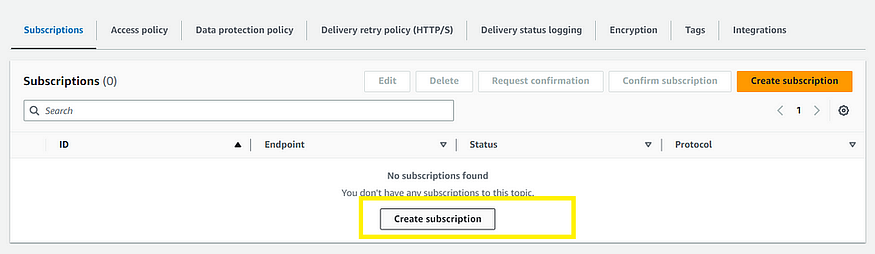
3. Now, Subscribe to the SNS topic with the email address and click on Create subscription.
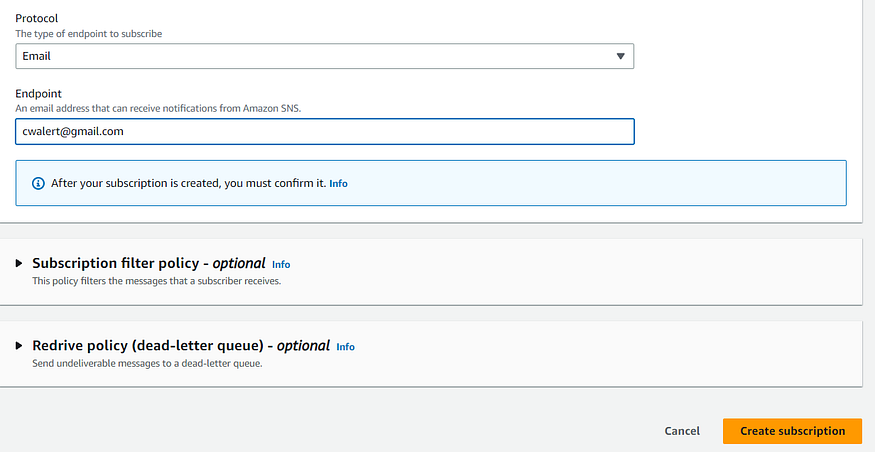
4. Select the protocol type Email under the dropdown menu and enter your email address under the Endpoint section and leave the rest of the option default and click on Create subscription.
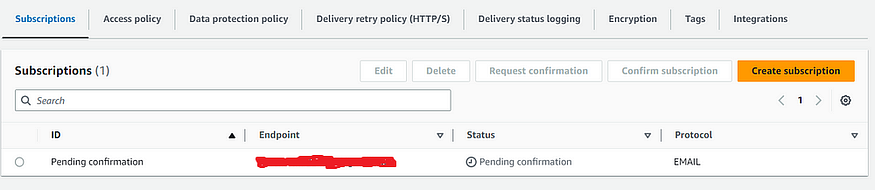
5. Now, under the subscriptions, you will see it is showing pending confirmation.
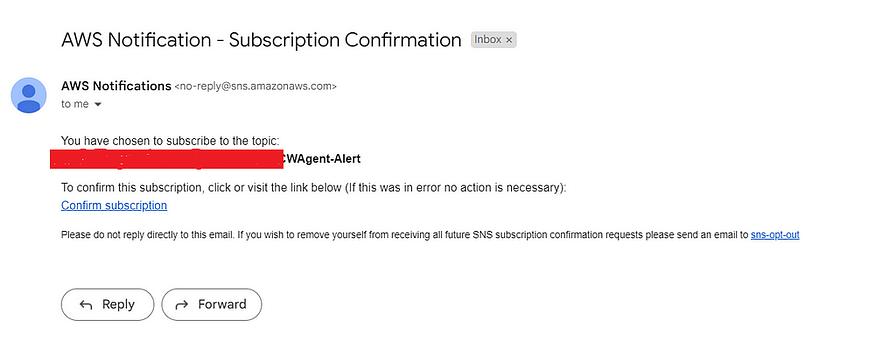
6. Go to your Gmail you will get a mail to confirm the subscription click on confirm subscription link to confirm your subscription.
After confirming the subscription you will see the status of the subscription has been changed to confirmed. Now, you have successfully created an SNS topic and added your email address to get the alerts. Now, let’s move on to our final step in which we will create a CloudWatch alarm.
Step 8: Create a CloudWatch Alarm.
In this final step, we will create a CloudWatch alarm that will monitor the memory metrics and send the alert to our SNS topic that we have created in the previous step.
- Go back to the CloudWatch service and on the right side select “All alarms” and then click on “Create alarm”

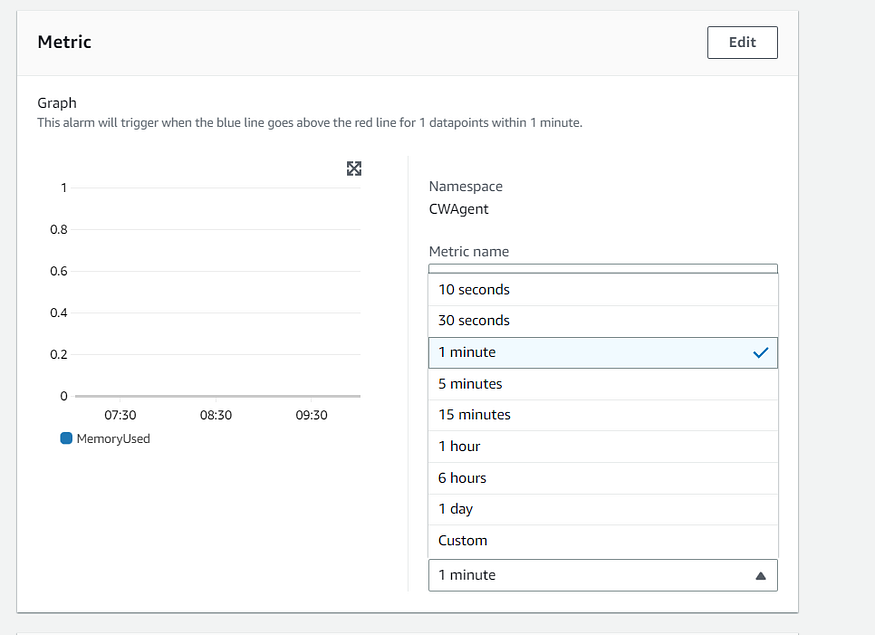
2. Under “Specify metric and conditions” Select custom namespaces “CWAgent” and then click on “InstanceId”. Select the “MemoryUsed” metric which will only monitor the memory usage of the Ec2 Instance.
3. Now, select the metric period to one minute.
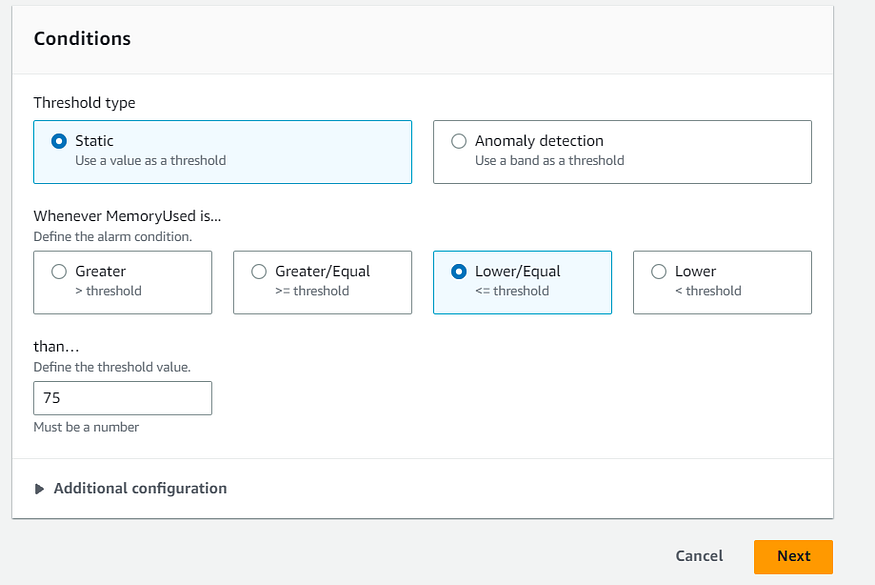
4. Select the Threshold type “Static” add the condition “Lower/Equal” and then enter the threshold value of 75. This means if the memory usage is less than equal to 75% it will not trigger the alarm but if it’s more than 75% then it will be in an alarm state. Leave the Additional configuration default and click Next.
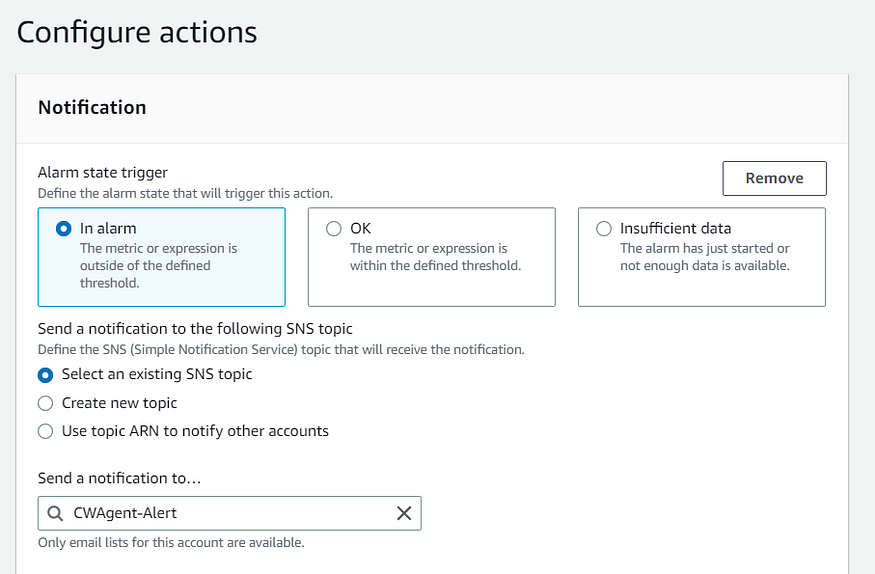
5. In Configure Action Step select Alarm trigger state to “In alarm” select an existing SNS topic and choose the SNS topic from the drop-down menu that we have created in the previous step. In our case, it is “CWAgent-Alert” and then click on Next.
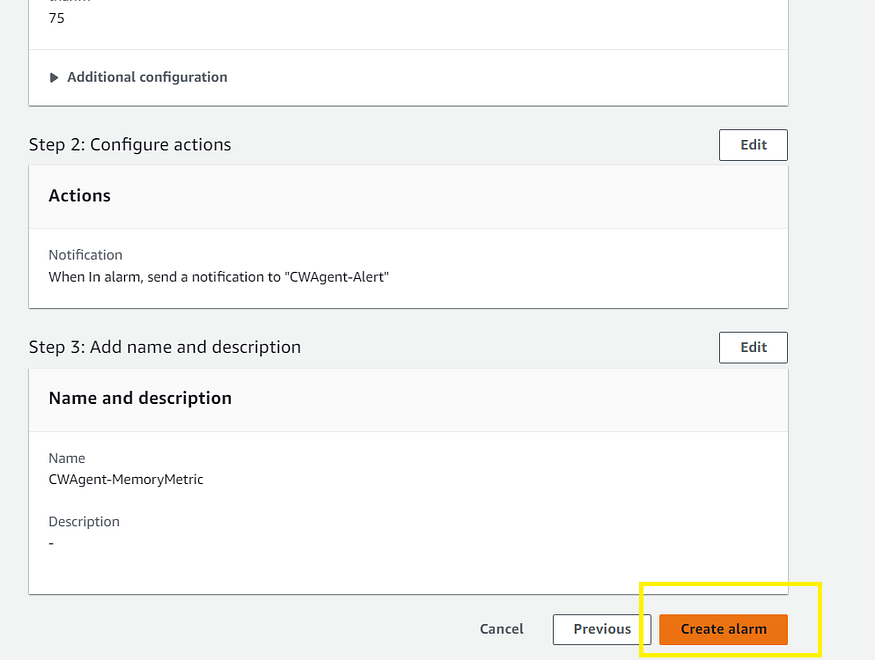
6. Add the Alarm name and then click on Next.

7. Scroll down preview the steps and click on Create alarm.
Congratulations! 👏Now, You have successfully created the cloudwatch alarm which will trigger when the Ec2 instance memory goes above 75%.
Conclusion:
In this article, We have performed, How to install and configure the cloudwatch agent on Ec2 Instance using AWS System Manager. Lastly, we have created a cloudwatch alarm that monitors the Ec2 Instance memory usage every minute and sends an email alert using the SNS topic if the server memory usage goes above 75%.
Follow-up
If you enjoy reading and would like to read more in the future. Please subscribe here and connect with me on LinkedIn.
You can buy me a coffee too🤎🤎🤎